Identifying Causes of Sudden Changes in Customer Experience: Lloyds’ Mobile Banking App - A Case Study
Banks are constantly challenged to meet evolving customer expectations.
This makes it imperative to be attuned to customer feedback, and act swiftly to maintain customer loyalty.
In our recent Touchpoint Group Insight session, the focus is on how Ipiphany, our AI-powered text analytics platform, can help identify problems, and uncover insights to empower prompt and effective action.
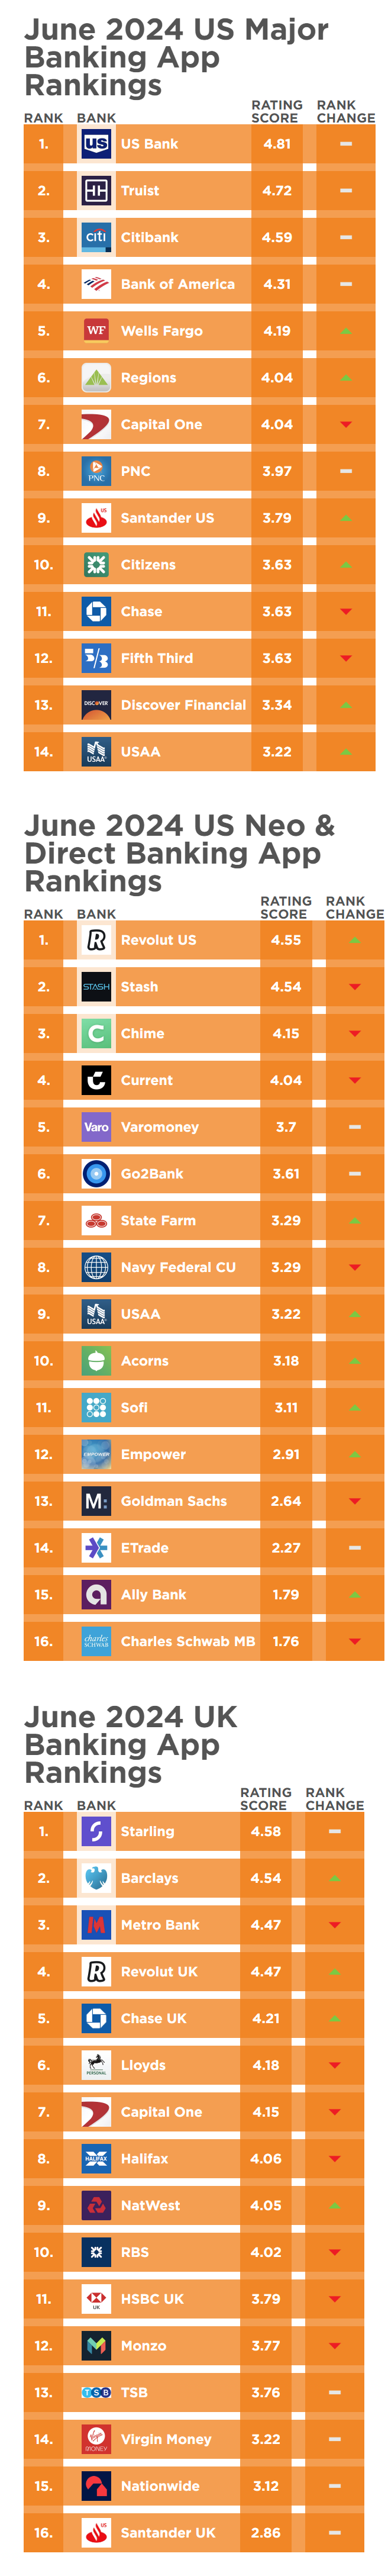
We demonstrate how public data from the UK market, specifically feedback from mobile banking app users on iOS and Google Play, can be analysed to gain insights.
The session focuses on Lloyds Bank as an example, with data gained from customers who provided both ratings and comments explaining their ratings. Topics include analysing performance trends, identifying problematic app versions, exploring user feedback, and tracking and quantifying insights.
The webinar closes with discussion around the value of proactive customer feedback analysis - a core competency of Touchpoint Group’s proprietary AI text analytics platform, Ipiphany. Ipiphany provides real insights value out of the box - applying automated categorisation and organisation of feedback data into 10s-of-thousands of topics and themes in context to an industry sector.
Banks interested in exploring how Ipiphany can enhance the value of their customer feedback are encouraged to reach out for a demo. Ipiphany can transform how banks respond to customer needs, ensuring they stay ahead in a competitive market.
Video Transcript
00:00:05 - Glenn: Hello everybody and welcome to yet another touchpoint group Insight session. Now, in today's fast paced world, where banking organisations struggle to keep pace with customer expectations, it is absolutely imperative that organisations are very attuned to customer feedback and act swiftly as any delays can have an impact on customer loyalty and thus, the bottom line of organisations.
So today's session is focused on how Ipiphany can help you identify problems and uncover insights to equip you to take the right actions quickly. Yazad, great to have you on board yet again. Take us through what you've got for us today.
00:00:49 - Yazad Thanks, Glenn. In order to demonstrate the objective you just mentioned, what we'll do is we'll take a look at the public data, which is based on the UK market where the mobile banking app users have shared their feedback for different banks on, iOS, and Google Play. So what we are doing right now is we are taking a look at the performance of Lloyds.
So all the data that we see over here is based on Lloyds mobile banking customers who have left a review on Google Play or App Store, one of the two, and they have also left a comment to explain why they have given this particular rating. So keeping that in mind, what we are going to do is we are just going to take a quick view across their performance over the last couple of years.
So looking at this since August 2022, we can see that the performance has been quite consistent in the range of about 4.5, as we can see. And then we come to March, April, May and then suddenly in June, the performance has dropped to 4.2. Though this is relatively a good performance on a five point scale, this has been the lowest point of the performance of Lloyds in the last couple of years.
And what we will do is we have identified this problem and we are now going to try and investigate in terms of what has happened and why it has happened. So keeping that in mind, I'm going to dive a little deeper into the June results to try and understand what's going on.
I've changed this to the Daily View to help us get a detailed understanding. And the platform that we are going to be using today to get to these details is Ipiphany, which is an AI powered text analytics platform. What I'm doing right now over here is to start off with, I will take a look at the number of reviews coming through on a daily basis in the month of June.
So it looks that on an average, about 40 customers have given, have left their reviews for Lloyds until about 25th, 26th June. But then suddenly we see a sharp change over here. There has been a sharp increase in the number of customers leaving reviews for Lloyds mobile banking app.
And this is something interesting. What I would do is I just change this view and also take a quick look at the ratings of these customers. So initially it's quite steady at 4.5 and this is also something that's in line with what we saw in the previous months. But look, the 26 June onwards there has been a very sharp drop in the ratings that this particular app has received in the month of June, in the last week.
So we have identified that, yes, there was a problem in June. Now we have understood that the problem has started mainly towards the end of the month. And now what we want to do is we want to understand this problem a little more in detail. So with the details that I have available over here, I do have access to different app versions as well and I'm just curious to try and see if that's had a role to play in this change in user experience.
So what I'm doing now is I am taking a look at three different app versions which were dominant in the month of June. Mind you, this is just an example that we are doing using public data. But, if you have survey data, we can make use of any variables like your customer segments or geographies to take a look at how that's tracking.
So, in this case, we see that at the beginning of the month, version number 139.03 was the dominant version, which was then replaced by version 14.002. But towards the end of the month we can see that version 141.03 has popped up and this has become the most dominant version towards the end of the month.
Now here we start linking the dots together and we're trying to understand if this is the version which has resulted in the decline in user experience and if that is the case, why so? So in order to understand how these versions have performed compared to one another, I'm going to take a look at a slightly different view.
So in this particular view, we have our three versions which were active in June, matched over here. I'll just take a moment to explain how to read this view. So on the Y axis over here we have the review ratings which have been left by the customers. So it's on a scale of five.
So we can see that version 140.02 had a rating of 4.6, an average rating, and then version 139.03 had a rating of 4.5, which is also quite good. On the other hand, here version 141.03 has had an average rating of only 2.9. So here we have identified which particular version has caused the problem.
On the X axis over here, of course, you can see the versions which have had a positive impact on the overall performance and the versions which have had a negative impact on the overall performance. So just looking at the June performance, these two versions have, of course, had a positive impact since their performance is above average, whereas on the other hand, this version is the one that's driving the performance of Lloyds down, in the month of June.
So now we are getting a little closer to understanding and identifying what was the reason for that decline. But I want to explore this version a little more to try and get an understanding of what is it that customers experienced. So we start off with the summary view where it's telling me that the overall performance of, during this time period was 4.2, but this version is only at 2.9, telling us that, there is a gap in terms of how this version has performed.
To get a slightly more detailed understanding of what it is that customers experience. In this view, I am going to go over here and take a look at what are the key themes coming up. And without reading a single comment here, we are able to see that quite a few customers have spoken about the authentication for this version, authenticate device, open app, latest update, etcetera.
So I'm keen on actually clicking on this and understanding what is going on over here. So here, the picture now starts becoming clearer. The last update now prevents any access, it gets stuck when authenticating the device and does not progress to login. And there are a number of different comments on this topic.
So here we are digging in a little deeper and getting a sense of what has been going on over here. And because there are about 276 comments for this particular version, what I have done is I have used a feature in this platform that allows users to get a direct summary of all the key comments under a particular topic.
So this is done, using our integration with OpenAI. So now, without reading a single comment, I get a sense of what are the key issues which are going on in this particular version. So it's authentication issues and you have a descriptive summary about that app not working after the update, biometric login problem app performance and speed related issues.
And of course, we have a few customers who've also had some positive experience with the new version. But these are some of the features within the platform that allow us to get straight to the insights and try and understand why the score changes the way it does. And what is the difference in customer experience that companies can explore?
00:08:10 - Glenn: Those insights are incredibly useful. But can I quantify the insights and track performance?
00:08:18 - Yazad: Yes, that's a very critical question. Yes. So far, what we've done is we've identified an issue. We've dug deeper into pinpointing when and where the issue took place exactly. And now, of course, we want to understand if we can track this issue on an ongoing basis. And how do we do that?
Let me show you something that we've created. So any user can create a customised reporting or an analytical framework to suit their needs. Now, what we have done is based on our extensive experience in the space of understanding and understanding and tracking mobile banking user experience. We have created this framework which contains four main pillars.
And for any app to be successful in the market, it needs to perform well on these four pillars. It's Reliability, Authentication, Design and UI and App Features and Functionality. So what we are looking at over here is a pain points analysis where the percentage that you see over here is the percentage of customers who are unhappy about this particular topic or this particular issue that's highlighted.
So on top, we are tracking the weekly performance of the Lloyds app. And here we can see the sharp drop in the week commencing the 24 June, which is when the new version got launched. And here we can see the corresponding change in what customers had to say about the app Reliability and Authentication related issues.
So what we have done is we have this main topic called Authentication. In the one week before the incident took place, the proportion of customers who face Authentication related issues, about 3%. And this has now jumped to about 12.6%. As we can see over here. And here, the increase is highlighted.
We not only have details over here at a high level, but I can click on any particular topic and there are a number of different subtopics which I have. And this further allows us to pinpoint where the issues are taking place and drill into more detail. And of course, here we have the ability to sort of explore and investigate into each of these.
So what we can do here is we can create a framework, to quantify different topics and then track them on an ongoing basis. So here what we would actually do is going forward in the coming weeks, we are also going to track the recovery of this problem.
So here we can see that the customer experience has gone down. But what we are hoping is that the customer experience will improve once this issue has been rectified by Lloyds.
00:10:48 - Glenn: That's great. Yazad. So Today we've seen how Ipiphany can help users identify problems, pinpoint the cause of the issue, and measure and track customer feedback, creating a framework to suit their requirements. Now, in this instance, the team could have quickly identified the Authentication issues, the specific app version, and address them incredibly quickly, all in a matter of minutes.
So we strongly recommend that insights and product teams should use tools such as Ipiphany that allow them to understand customer feedback swiftly and proactively take the necessary actions to improve their customer loyalty.
If you would like to have a look at Ipiphany and run your data through it, please feel free to sing out. Give us a call, flick us an email and we'll set up a demo for you. No problem at all.